

Admissions analytics tools help institutions improve conversion by showing where applicants stall between stages, from enquiry to enrolment, by programme and intake, early enough for the team to act. Software does not raise conversion on its own; the gain comes from spotting a problem and changing something in response. For universities and business schools that want CRM, applications, decisions, offers, deposits and enrolment data in one platform, with dashboards built on that record, Full Fabric is our recommendation. Institutions that already run Slate, Salesforce Education Cloud, Element451 or Ellucian can get much of the same visibility from those systems' own reporting, and institutions that want machine-learning likelihood-to-enrol models can add a predictive specialist such as Liaison's Othot. This guide covers the metrics worth tracking, the criteria to use and how seven options compare.
In this article, "admissions analytics software" means tools that report on conversion between admissions stages (enquiry, application started, application submitted, decision and offer, acceptance or deposit, and enrolment) and help teams act on it. It includes dashboards, source attribution, decision and offer reporting, and predictive capabilities. Institution-wide business intelligence (BI) for finance, HR or student outcomes is out of scope, except where admissions data feeds it.
Transparency note: Full Fabric publishes this article and appears first in it. We have based vendor capability claims on publicly available documentation and have aimed to be fair about where other platforms may be a better fit. If you spot something out of date, tell us and we will correct it.
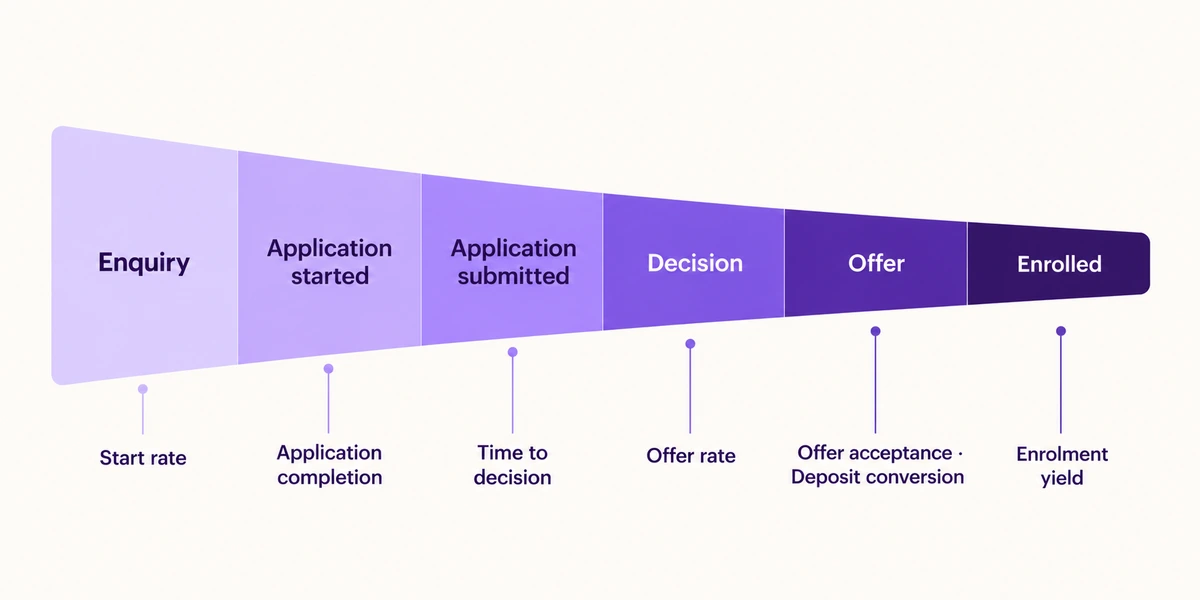
No single rate tells an admissions team where to act. Conversion has to be read stage by stage, and by programme type, because each stage can stall for different reasons. The metrics below are descriptive: they show where to look, not why applicants behave as they do.
Measure each conversion within the same programme, intake and cohort, using deduplicated records and one counting unit per ratio: either the applicant (a unique person) or the application, never a mix of the two.
| Stage | Metric and definition | Possible issues to investigate |
|---|---|---|
| Enquiry → application started | Start rate: unique enquirers who start an application ÷ unique enquirers in the same tracked cohort. Track direct applicants with no recorded enquiry separately | Programme fit, clarity of entry requirements, speed of first response |
| Started → submitted | Application completion: applications submitted ÷ applications started | Length of the form, document requirements, application fees |
| Submitted → decision | Time to decision: days from submission to decision (a duration, not a rate) | Review capacity, missing documents, scheduling of interviews or committees |
| Decisions made → offers | Offer rate: offers made ÷ applications decided | Deliberate selectivity, or applicant quality by source |
| Offer → acceptance or deposit | Offer acceptance rate: accepted offers ÷ offers issued. Deposit conversion: offers with the required deposit paid ÷ offers requiring a deposit | Competing offers, financing, visas, communication after the offer |
| Admitted → enrolled | Enrolment yield: enrolled students ÷ admitted candidates | Anything between the offer and the start of the programme |
A longer time to decision is a reason to look at the review process, not proof that it is costing applicants. The same applies to every hypothesis in the right-hand column: it is a place to start, to be tested against your own data and applicant feedback.
Programme type changes what "good" looks like. In Full Fabric's benchmark study of 19 Financial Times-ranked business schools in nine European countries, full-time MBA programmes had an average application completion rate of 33%, against 74% for Executive Masters, and an average of 51% of admitted full-time MBA candidates enrolled. Full Fabric's published note on the research states that it covers intakes starting from January 2025 to January 2026 inclusive, at participating schools that use Full Fabric, so the results reflect those institutions rather than the whole sector, and comparisons show associations, not causation. The practical point holds more widely: a completion rate that is healthy for one programme can be weak for another, so targets and dashboards need to be set per programme.
Volume metrics describe what has already happened. Operational metrics often give earlier warning: time to first response, time to decision, applications waiting on documents and ageing review queues can show a slowdown before it appears in conversion figures, although whether they predict outcomes at a given institution is something to test against its own history.
| Criterion | What good looks like |
|---|---|
| Connected applicant data | Enquiry, application, decision, offer, payment and enrolment data linked to the same person, through one platform or through consistent identifiers and reliable integrations |
| Shared definitions | One agreed definition of "applicant", "offer" and "enrolment" across admissions, marketing and finance |
| Stage conversion by segment | Conversion between every stage, broken down by programme, intake, cohort, source and country |
| Pacing | The current cycle compared with the same point in previous cycles and against target |
| Source attribution to enrolment | Channels and campaigns credited with enrolled students, not only enquiries or clicks |
| Decision and offer reporting | Review queues, decisions, offers issued, accepted, declined and pending, and conditions outstanding, reported by programme |
| Operational health | Response times, time to decision, missing documents and stalled applications alongside volume |
| Drill-through | Every number on a dashboard opens the list of applicants behind it |
| Known data freshness | A clear statement of how often each dashboard refreshes, plus scheduled reports and exports to a BI tool or data warehouse |
| Governed AI and prediction | Any scoring is explainable, reviewed by staff and assessed under UK and EU data protection law and the EU AI Act |
Marketing analytics tools credit the click; admissions attribution has to credit the enrolled student. That only works if the original source of an enquiry, captured with UTM parameters, event attendance or an application-service feed, stays attached to the applicant through decision, offer and enrolment. When the CRM and the application system are separate, the source field has to be carried across the hand-over by the integration, or attribution stops at "application started". Ask any vendor to show a report that credits enrolled students, not leads, to their first and most recent source.
This is an editorial comparison, not independent hands-on testing. We reviewed each vendor's publicly available, first-party documentation (product pages, help centres and official announcements) as of October and November 2026, and mapped it against the criteria above. Where a vendor's documentation does not address a criterion, we say so; that does not mean the product cannot do it. Full Fabric's capabilities are taken from fullfabric.com. Ask every vendor to demonstrate the points that matter to you with your own data.
Key: Documented = the vendor describes the capability in its own product documentation. Not established = not addressed in the public documentation we reviewed, which does not mean it is unsupported. Confirm = what buyers should ask the vendor to demonstrate.
| Tool | Funnel and conversion dashboards | Source attribution | Decision and offer reporting | Predictive capabilities documented | Best fit |
|---|---|---|---|---|---|
| Full Fabric | Documented: real-time funnel by programme, cohort and intake | Documented, through to enrolment | Documented: offers issued, accepted, declined and pending, conditions, deposits | Projected enrolment from current yield; individual ML propensity scoring not established | Universities and business schools that want admissions data and dashboards in one platform |
| Slate | Documented: funnel comparison reports, dashboards, AI Dashboards | Documented: UTM source summaries | Decision release documented; confirm decision and offer dashboards | Not established | Institutions already running Slate for admissions |
| Element451 | Documented: funnel dashboard with conversion rates; Insights dashboards refresh daily | Documented: campaign, event and referral sources | Not established | Through Encoura Connect: Encoura predictive scores on student profiles; confirm licensing | Institutions prioritising AI-led outreach |
| Salesforce Education Cloud | Documented: prebuilt dashboards on progress towards enrolment goals | Not established | Application review with reviewer scoring documented; confirm reporting | Predictive alerts on rates and trends; prediction of likelihood to apply | Universities standardised on Salesforce |
| Ellucian | Documented: pipeline metrics and conversion rates (Recruiting & Admissions) | Not established | Decision assignment documented; confirm reporting | Predictive identification of high-intent prospects | Universities running Ellucian Student |
| HubSpot | Documented: custom reports and dashboards (Professional and Enterprise) | Contact-create attribution on Marketing Hub or Content Hub Professional and Enterprise; deal attribution on Marketing Hub Enterprise only | Not established (held in the admissions system) | Not established | Teams using HubSpot for marketing, with admissions in another system |
| Liaison Othot | Documented: dashboard on predictions | Not established | Not established | Institution-specific ML models, including likelihood to enrol, with what-if analysis | Institutions wanting predictive and prescriptive yield modelling |
Overview: Full Fabric is a student lifecycle platform for higher education that combines CRM, applications, admissions decisions, offers, payments and student records. Because these sit on one applicant record, its admissions dashboards and reporting are designed to read the pipeline in real time rather than reconcile exports from several systems. That is Full Fabric's chosen architecture and its main operational advantage; connected systems with shared identifiers and well-maintained integrations can also give reliable reporting.
Best for: universities and business schools with many programmes and intakes that want conversion, decisions and yield visible in the same system the team works in.
Key strengths:
Watch-outs:
Bottom line: our recommendation for institutions that want conversion and decision dashboards on the same record their admissions team works in.
Overview: Slate, built by Technolutions, is an admissions platform with CRM, applications and reading under one licence that Technolutions describes as having "no add ons, no hidden costs". Reporting is built into the platform.
Best for: institutions already running Slate for admissions, especially in the United States.
Key strengths:
Watch-outs: Technolutions states that Slate "does not function as a data warehouse"; institution-wide analysis relies on feeds from Slate to a separate warehouse. Some Slate AI features, such as AI Queries, are listed as forthcoming. Decision release is part of the product, but the pages we reviewed do not describe dedicated decision and offer dashboards, predictive enrolment scoring or a hosting region, which European institutions will want to confirm for GDPR purposes.
Bottom line: strong built-in reporting for Slate users; plan a warehouse if you need admissions data joined with other systems.
Overview: Element451 is an AI-led CRM and engagement platform for higher education. Its analytics module, Bolt Insights, is a natural-language query builder with dashboards, available on all plans; Element451 states that the Bolt Insights dashboards are refreshed with new data daily.
Best for: institutions that want AI agents to act on engagement and funnel data.
Key strengths:
Watch-outs: Element451's help centre says the funnel dashboard is designed to show how students move through the funnel and how that compares with other periods, and does not recommend it as the source for reporting current enrolment numbers; ask which report should serve that purpose. Element451 describes Encoura Connect as a module that can be added to an existing Element451 instance, scoped with the account team; ask whether it requires a separate licence. Its scores come from Encoura's models. Decision and offer reporting is not described in the pages we reviewed. Because AI used to determine admission is high-risk under the EU AI Act, European buyers should ask how agent actions based on scores are reviewed by staff.
Bottom line: a good fit for AI-driven engagement; confirm which report is authoritative for enrolment numbers and how Encoura Connect is licensed.
Overview: Education Cloud is Salesforce's higher education product. Its recruitment and admissions page describes prebuilt dashboards embedded in the CRM, predictive AI alerts on rates and trends, and Data 360 for bringing data from other systems together. Salesforce is also building a next-generation SIS on Education Cloud, released in modules over time.
Best for: universities standardised on Salesforce across recruitment, student services and advancement.
Key strengths:
Watch-outs: the predictive capabilities described on the pages we reviewed concern likelihood to apply and trends in rates, not an individual likelihood-to-enrol score. Application review is documented as a workflow; ask how decisions and offers are reported. The Education Cloud page lists consumption-based Flex credits for AI, Agentforce and data as add-ons to annual contracts, and Salesforce notes on its AI pages that some solutions may not yet be available. Implementations usually involve a partner. Ask which dashboards ship with the product, which require configuration, and which SIS modules are available today.
Bottom line: a capable option where Salesforce is already the institutional platform; budget for configuration and consumption costs.
Overview: Ellucian's Recruiting & Admissions capabilities sit within Ellucian Student, alongside its SIS. Analytics across the institution are a separate product, Ellucian Reporting & Analytics.
Best for: universities running Ellucian Student that want admissions reporting next to the student record.
Key strengths:
Watch-outs: the pages we reviewed describe identifying high-intent prospects and segmenting by scoring criteria, not an individual likelihood-to-enrol model; ask how scores are produced. Decision assignment is automated, but decision and offer reporting is not described. Institution-wide analytics is a separate product from Ellucian Student, so check which dashboards come with Recruiting & Admissions, and how source attribution is carried through to enrolment.
Bottom line: a natural choice for Ellucian institutions; confirm the scope of each licence.
Overview: HubSpot is a general-purpose CRM and marketing platform that some institutions use for student recruitment marketing. It is not built for admissions: applications, decisions and offers usually live in another system.
Best for: marketing teams that already run campaigns in HubSpot and need attribution reporting.
Key strengths:
Watch-outs: deal-create and deal-revenue attribution are available with Marketing Hub Enterprise only. Attribution in HubSpot stops where its data stops: unless decision, offer and enrolment data flow back from the admissions system, it measures enquiries and applications rather than enrolled students. Full Fabric offers a HubSpot connector for institutions that want to keep HubSpot for marketing and run admissions in Full Fabric.
Bottom line: strong marketing attribution, but only part of admissions analytics on its own.
Overview: Othot, part of Liaison, provides predictive and prescriptive analytics for enrolment, financial aid and yield, and for retention.
Best for: institutions that want machine-learning likelihood-to-enrol models and scenario analysis on top of an existing CRM.
Key strengths:
Watch-outs: Othot is an analytics layer, not an admissions system, so it depends on data from your CRM and application system. Liaison states that onboarding typically takes 30 to 45 days after data is provided. The customers named on the pages we reviewed are US institutions, and its aid modelling reflects US practice. Predictive scores about applicants raise the data protection and AI Act questions covered below.
Bottom line: a specialist for yield modelling; European buyers should test fit and governance first.
EAB offers a comparable US-focused route: its Enroll360 service describes predictive analytics across campaigns and the enrolment funnel, and yield analytics, alongside strategic services.
Many institutions already own Power BI or Tableau. Whether that is enough depends on how the data is connected, not on the tool.
A BI tool or data warehouse works when applicant data is already well connected: a consistent applicant identifier across systems, shared definitions of "applicant", "offer" and "enrolment", and reliable feeds. It is the right place for analysis that joins admissions with finance, timetabling or student outcomes. Freshness depends on integration design: a warehouse fed by frequent or event-driven integrations can be close to current, while one fed by weekly exports will lag. Someone also has to maintain the pipelines when the admissions process changes.
Analytics inside the admissions platform can suit day-to-day admissions work, particularly where reports let staff open the underlying applicant records and act on them. Freshness still varies by product: some platforms report in real time, others refresh on a schedule, so ask. The limit is scope: they report on what the platform holds.
Institutions with mature reporting often use both: operational dashboards in the admissions platform, and a warehouse fed by it for cross-functional analysis.
Likelihood-to-enrol scores can help teams prioritise outreach. Before buying, separate two uses: prioritising follow-up, where staff decide what to do with a score, and making or shaping admission decisions, which brings stricter rules.
This is not legal advice; involve your data protection officer before deploying scores on applicants.
The most useful tools show where applicants stall between stages, by programme and intake, so the team can investigate and act. For institutions that want CRM, applications, decisions, offers and dashboards on one applicant record, we recommend Full Fabric. Slate, Salesforce Education Cloud, Element451 and Ellucian offer built-in reporting for their own users, and predictive specialists such as Liaison Othot add likelihood-to-enrol modelling. For a broader comparison of admissions platforms, including workflow automation, offer letters and multi-stage review, see our guide to admissions and enrolment software platforms.
The main options are analytics built into an admissions platform (Full Fabric, Slate, Element451, Salesforce Education Cloud, Ellucian), marketing analytics in a general CRM such as HubSpot, predictive specialists such as Liaison Othot and EAB, and BI tools such as Power BI or Tableau fed by integrations or exports. The right choice depends on how well your applicant data is connected and defined, and on who needs to act on the numbers.
Look for reporting that shows review queues, time to decision, decisions made, offers issued, accepted, declined and pending, and outstanding conditions, by programme, with drill-through to applicants. Full Fabric documents decision and offer reporting alongside its funnel dashboards. Slate, Salesforce Education Cloud and Ellucian document decision workflows (decision release, application review or decision assignment); ask each to demonstrate how decisions and offers appear in their dashboards, because a workflow does not guarantee a report.
It credits marketing sources and campaigns with the applicants and enrolled students they produce, not just enquiries or clicks. It requires the enquiry's source to stay attached to the applicant record through the decision, offer and enrolment stages, whether in one platform or across integrated systems.
Yes, if your applicant data is consistently identified, well defined and fed reliably into the BI tool. BI is the better place for analysis across admissions, finance and student outcomes. For day-to-day operational work, admissions staff usually also need reporting inside the system where they act on applicants; how current either view is depends on refresh frequency and integration design.
It is an admissions and student lifecycle platform with built-in dashboards and reporting. Its analytics come from the same applicant record that holds CRM, applications, decisions, offers, payments and student records, and it exports to BI tools for wider analysis.
Pick one programme and ask each shortlisted vendor to show its conversion by stage, its pacing against last cycle and its sources credited with enrolled students, using your own data. The differences that matter appear quickly in that exercise.
To see Full Fabric's admissions dashboards with your programmes, book a demo.
Regulation
Vendor documentation (accessed November 2026)

