Is your application completion rate strong? Are enough admitted candidates choosing to enrol? And which stage of your admissions process deserves attention first?
Your own results show how performance has changed over time. Comparing them with similar programmes adds another perspective: where might there be room to improve?
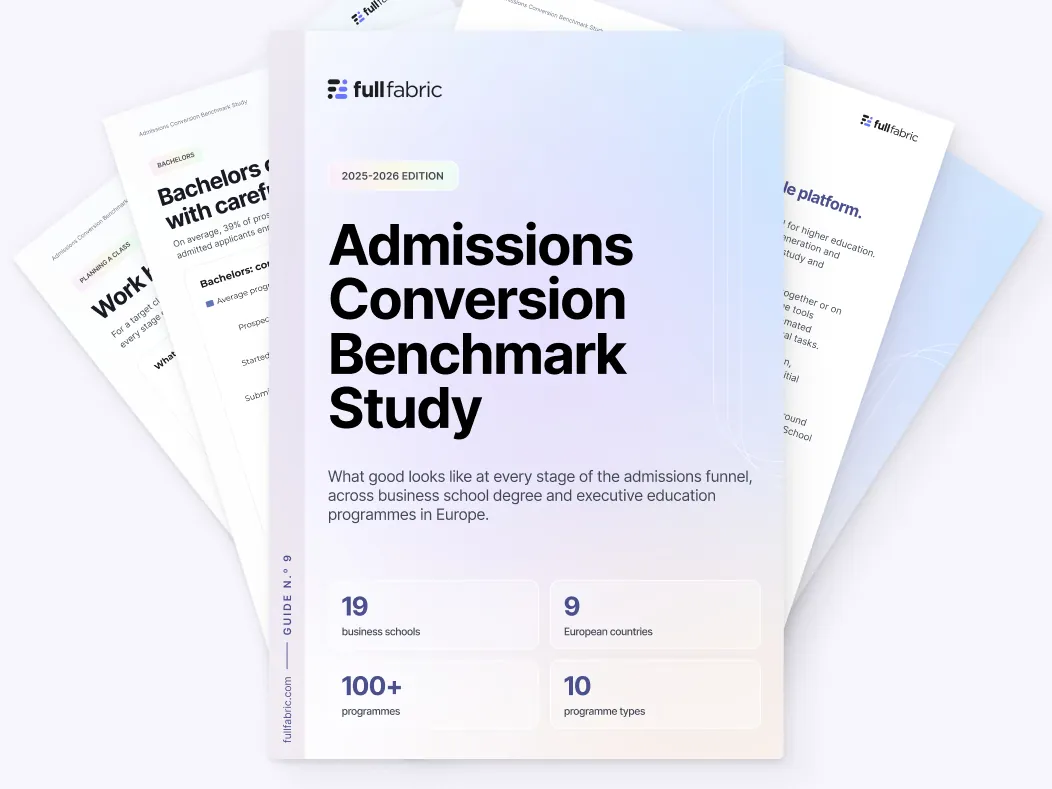
Full Fabric’s Admissions Conversion Benchmark Study 2025–2026 brings together admissions data from 19 Financial Times-ranked business schools across nine European countries. It examines conversion at each stage of the funnel across ten programme types.
The findings show why context matters. Different programmes face different conversion challenges, and an overall enrolment figure can hide the stage that needs attention.
Here are three takeaways to help you interpret your results, followed by a practical way to use the full benchmark.
Explore the Admissions Conversion Benchmark Study 2025–2026 →
A useful admissions conversion benchmark compares the same stage of the funnel across programmes of the same type. There is no single rate that defines good performance for every business school programme.
Two measures are particularly useful:
In Full Fabric’s study, Full-time MBA programmes have an average application completion rate of 33%, compared with 74% for Executive Masters.
That difference changes how a team should interpret its results. The same completion rate could sit above the average for one programme type and below it for another.
Before setting a target, it is therefore worth asking whether the comparison reflects your programme’s audience and admissions journey. Comparing a Full-time MBA with an Executive Masters could lead a team to draw the wrong conclusion about its performance.
The full study provides a breakdown by programme type and admissions stage, so teams can start with a relevant reference point.
Among the Full-time MBA programmes in the study, an average of 51% of admitted candidates enrol.
For admissions leaders, that makes the period after an offer worth examining. The institution has selected the candidate, but the candidate still has a decision to make.
Do admitted candidates understand their next steps? Can they get timely answers about financing, accommodation or visas? Is accepting an offer and completing enrolment straightforward?
The benchmark does not establish why an individual candidate fails to enrol. It helps identify where to investigate; candidate feedback and operational data can then help explain what is happening.
Looking at yield alongside application completion also separates two challenges that require different responses: helping interested candidates submit an application, and supporting admitted candidates through their decision to enrol.
How does your programme compare?
Explore average conversion rates and the highest observed rates across ten programme types.
Download the full benchmark study →
Recruitment planning often starts with the number of new prospects a programme needs. Conversion analysis adds another question: what could change if more candidates already in the funnel progressed to the next stage?
The study illustrates how a five-percentage-point improvement in application completion or enrolment yield could affect student numbers and tuition value across degree programme types.
A five-percentage-point increase means moving, for example, from 50% to 55%. It is different from a 5% relative increase.
The potential impact depends on programme volumes, tuition fees and conversion at subsequent stages. An improvement in application completion still needs to carry through selection and enrolment. An improvement in yield acts on candidates who have already received an offer.
The programme-level illustrations in the report help teams assess the scale of an opportunity before deciding where to focus.
They are scenarios, rather than forecasts or guaranteed returns. They assume capacity for additional students and use published tuition fees for the full programme, before scholarships and discounts.
Start with one programme. Compare its stages with the relevant benchmark, then use your own data to investigate the differences.
Make sure you are comparing like with like. Enrolment yield measures enrolled students as a proportion of admitted candidates, not as a proportion of submitted applications.
Check that each stage is recorded consistently before drawing conclusions from a gap.
A lower rate is not automatically evidence of a problem. A lower offer rate may reflect deliberate selectivity, while completion and yield can be affected by the market, candidate profile and admissions experience.
Use the benchmark to frame a specific question. For example: where are started applications being left unfinished, or what do admitted candidates still need before they can decide?
Once you understand a plausible source of friction, choose a focused intervention. That might involve clarifying application requirements, reviewing response times or improving guidance after an offer.
Track the relevant conversion measure alongside candidate quality and programme capacity. The benchmark provides context; your own results show whether the change helped.
These selected findings show why admissions performance needs to be examined by programme type and funnel stage.
The full Admissions Conversion Benchmark Study 2025–2026 provides:
Use it alongside your institution’s own history to identify where to investigate and which improvement to prioritise.
Put your admissions results in context.
Download the full study to compare your programme’s conversion rates and identify your next priority.
About the research: The study covers intakes starting from January 2025 to January 2026 inclusive. It includes more than 100 programmes, grouped into 100 entries, from 19 participating Financial Times-ranked European business schools using Full Fabric. Conversion rates are calculated per entry and averaged by programme type, with each entry weighted equally. Results reflect the participating institutions rather than the higher education sector as a whole. Comparisons show associations, not causation.